Case studyStarted by me
RedeAgromet
Live, in production
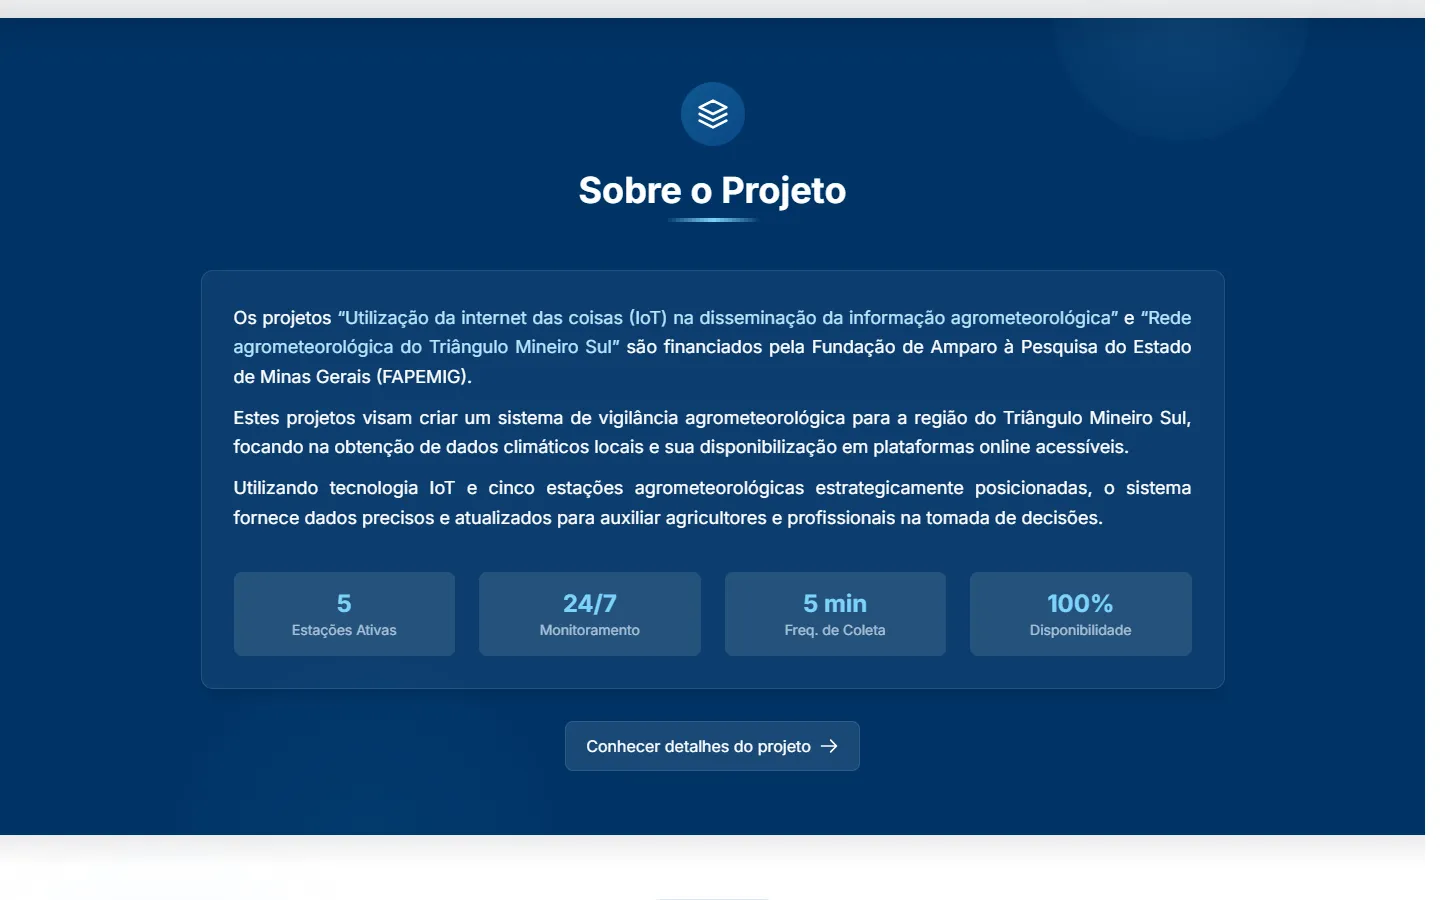
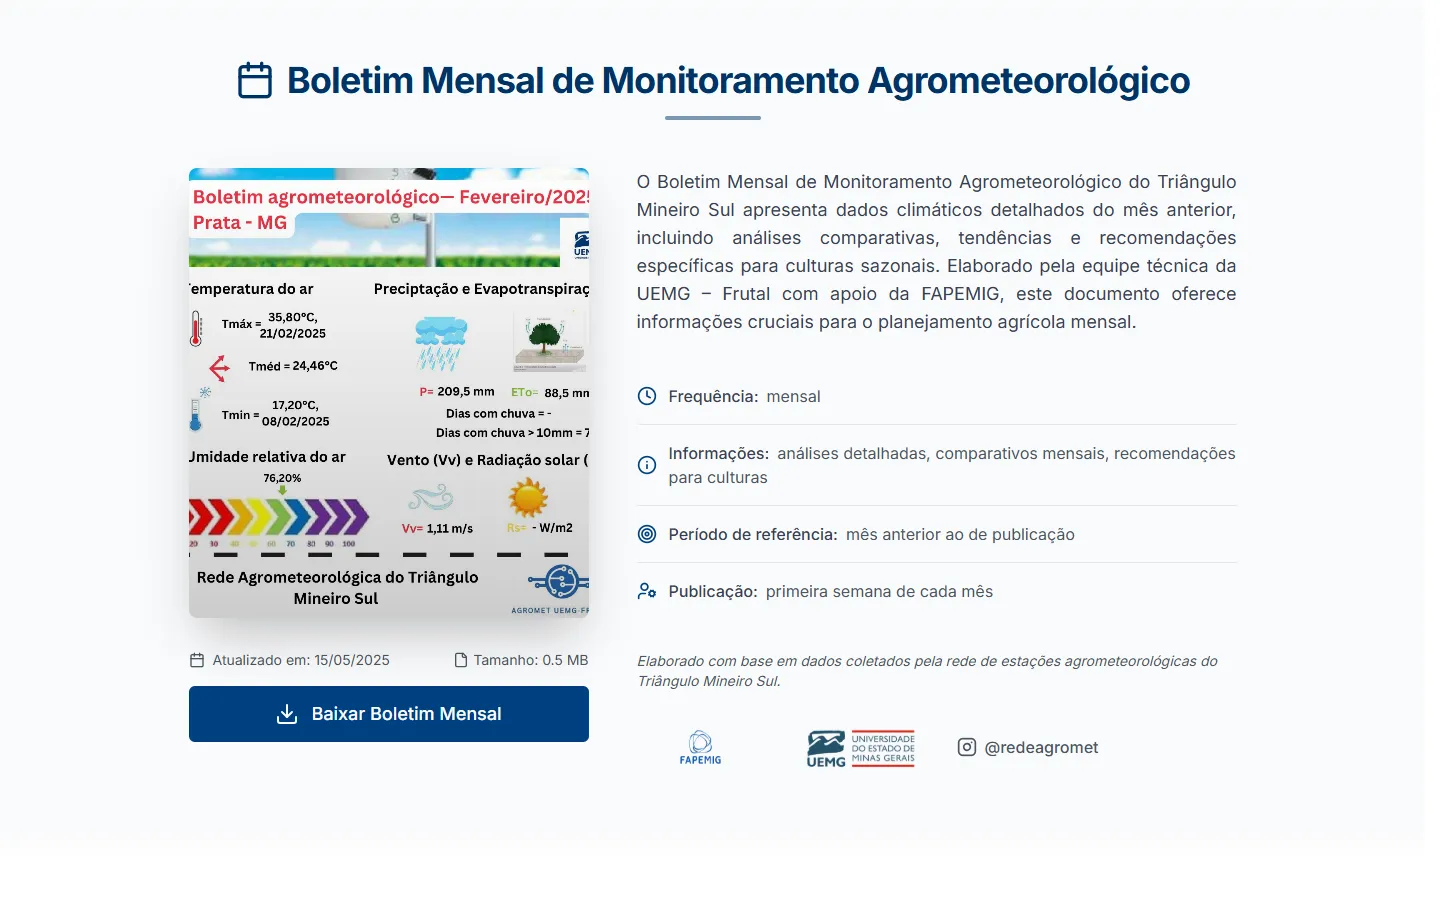
A public platform that turns data from automatic weather stations in the Southern Triângulo Mineiro into maps, charts and reports. I built it during undergraduate research and still work on it.
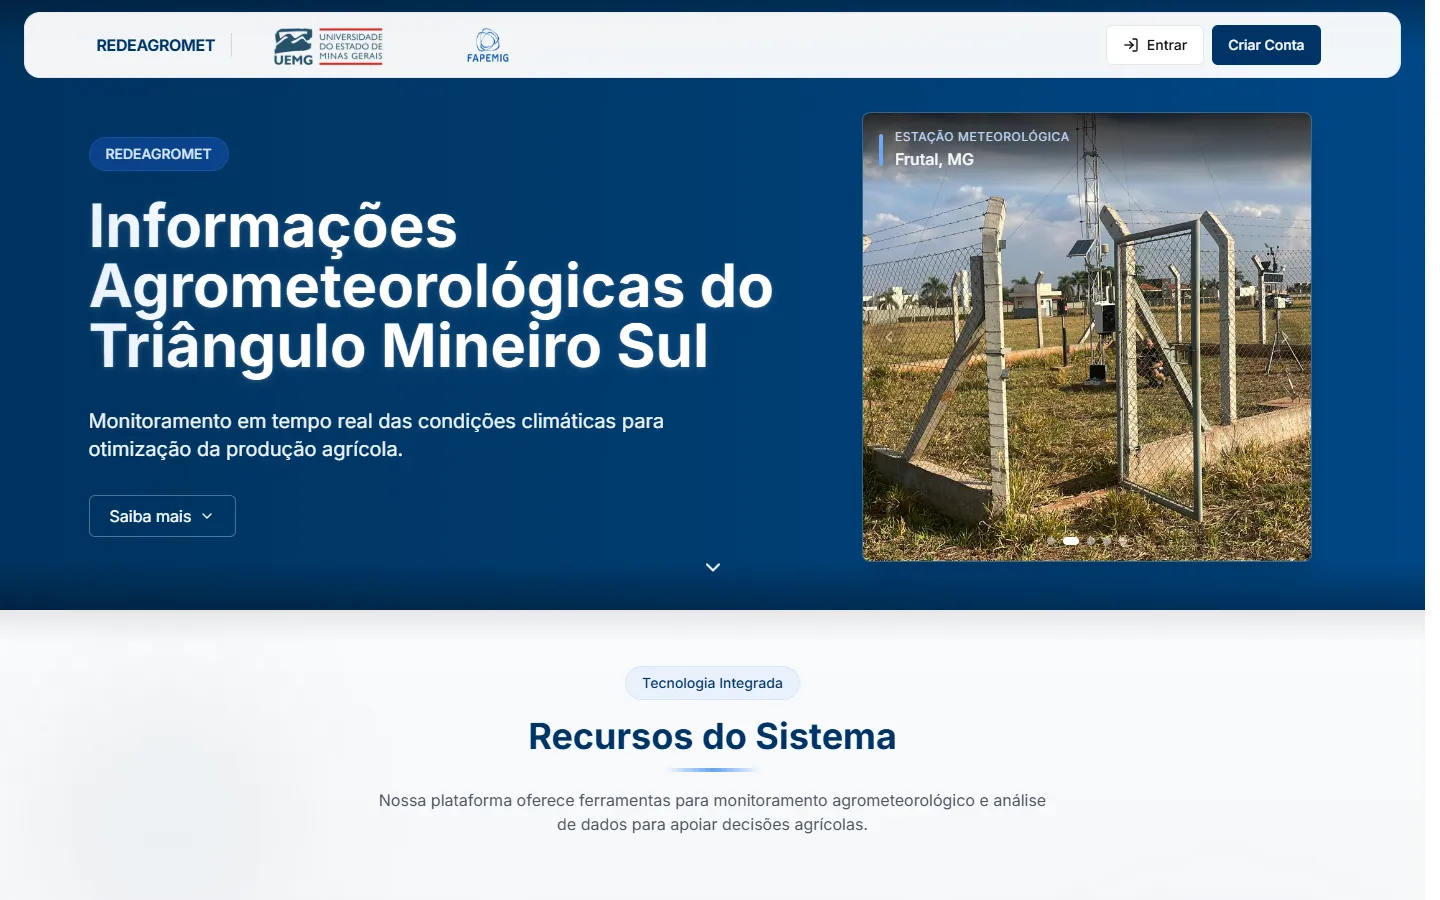
- Role
- I built the whole platform, my first large web system: collecting and checking the station data, the agricultural weather calculations, the public dashboards and the report downloads.
- Outcome
Ran at over 96% station availability, with new data about every 5 minutes. A usability pilot scored 82 out of 100 on the SUS scale.
It became my undergraduate thesis and took me to CBAgro 2025 in Porto Alegre as first author.
The platform is the subject of my first‑author paper in Revista Agrogeoambiental (2026).
- Challenge
- Turning raw station readings into numbers a farmer can trust: a serverless pipeline applies WMO-standard quality control, then reference evapotranspiration (FAO-56 Penman-Monteith) and growing degree days are calculated on top.
- Stack
 Next.js
 React
 TypeScript
 Tailwind CSS
 AWS Lambda
 Supabase
 PostgreSQL
 Plotly.js
 Leaflet
 Vercel
About the build
Automatic weather stations send readings to a serverless pipeline (AWS Lambda and EventBridge) that applies WMO-standard quality control. The platform calculates reference evapotranspiration (FAO-56 Penman-Monteith) and growing degree days, then publishes interactive charts, a station map and CSV, XLSX and PDF exports. The project was funded as undergraduate research (FAPEMIG/PAPq) and is still in production.